
Results Information
KS2 Results Comparison - St Lawrence CE Primary (2025/2026)
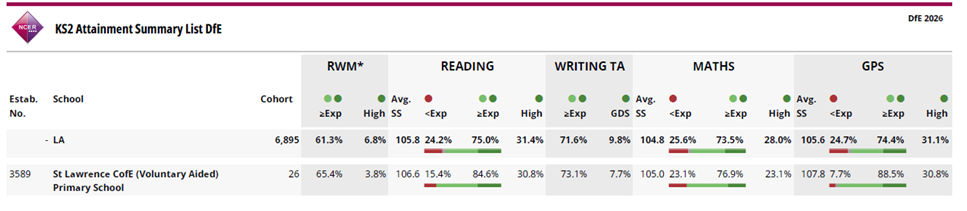
KS2 Results Comparison – St Lawrence CE Primary (2024/25)
Cohort size: 31 pupils
Percentage equivalence: 1 pupil = 3.2%
| Subject | School 2024/25 Expected | School 2024/25 Greater Depth | Approx. Pupils (Exp) | Approx. Pupils (GD) | National Expected (2025) | |||
|---|---|---|---|---|---|---|---|---|
| Reading, Writing & Maths Combined | 48.4% | 3.2% | 15 | 1 | 62% | |||
| Reading | 64.5% | 25.8% | 20 | 8 | 75% | |||
| Writing | 58.1% | 3.2% | 18 | 1 | 72% | |||
| Maths | 67.7% | 25.8% | 21 | 8 | 74% |
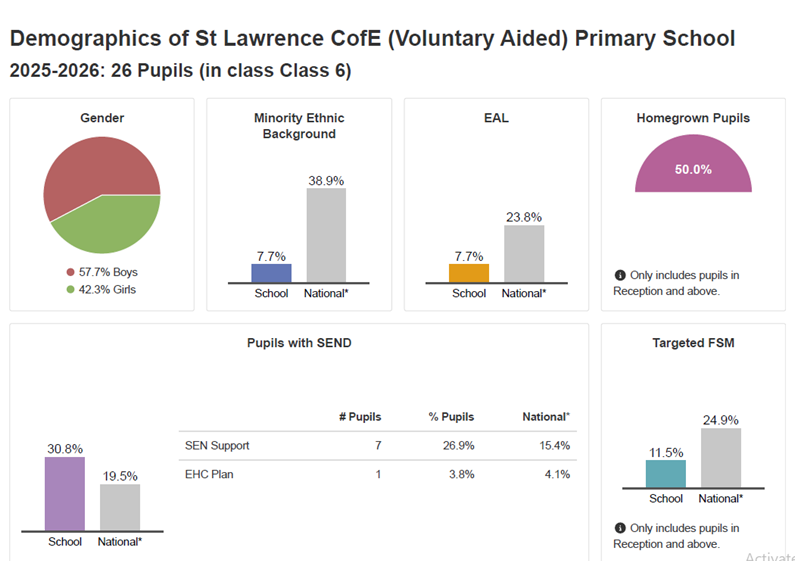
Cohort Context
| Category | School % | Approx. Pupils | National % |
|---|---|---|---|
| SEND | 35.5% | 11 pupils | 18.3% |
| EHCP | 9.7% | 3 pupils | ~4–5% |
Key Contextual Points
-
The cohort includes 35.5% SEND (approx. 11 pupils), which is significantly above the national average of 18.3%.
-
Within this group, 9.7% (approx. 3 pupils) have an EHCP.
-
Because 1 pupil equals 3.2%, the performance of a small number of pupils can significantly affect overall percentages.